Understanding Windows Task Manager's Physical Memory
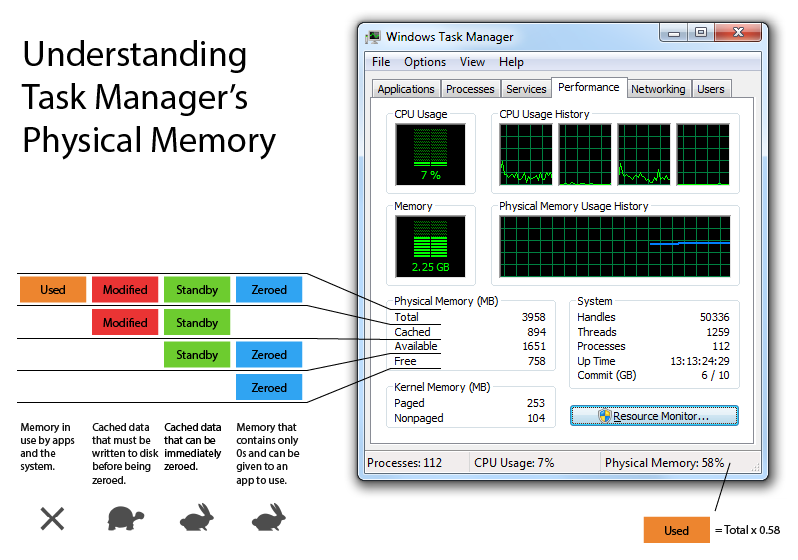
The following diagram explains the different groups of physical memory in Windows Task Manager. Feel free to share it.

You can download the Adobe Illustrator file for the diagram here: task_manager.ai
In case you try to add up the numbers, it’s important to note that the percentage of physical memory used (in the bottom right corner) is a rounded figure. Using the following calculation: (3958-894-758)/3958=0.58261… my actual memory usage is at 58.26%, but has been rounded down to 58%.
